Illustrate concepts
loess
Michael Sachs
8 March 2018
loess
\(\rightarrow\) enhances viewer’s understanding + insight
tour
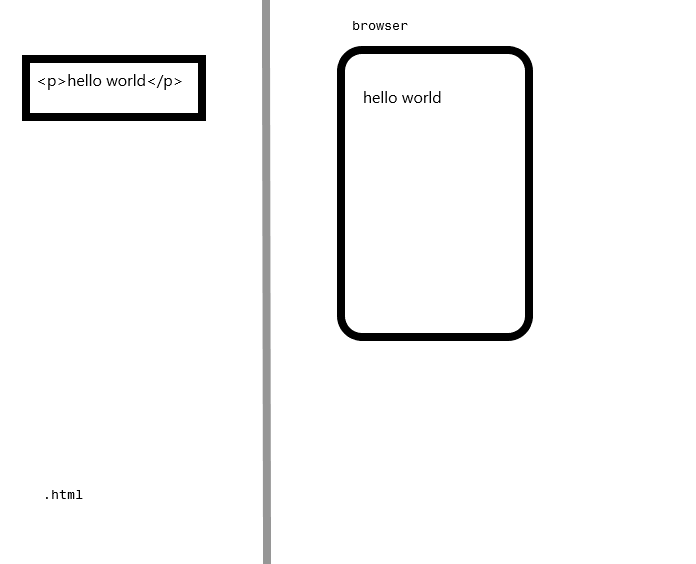
A static web page
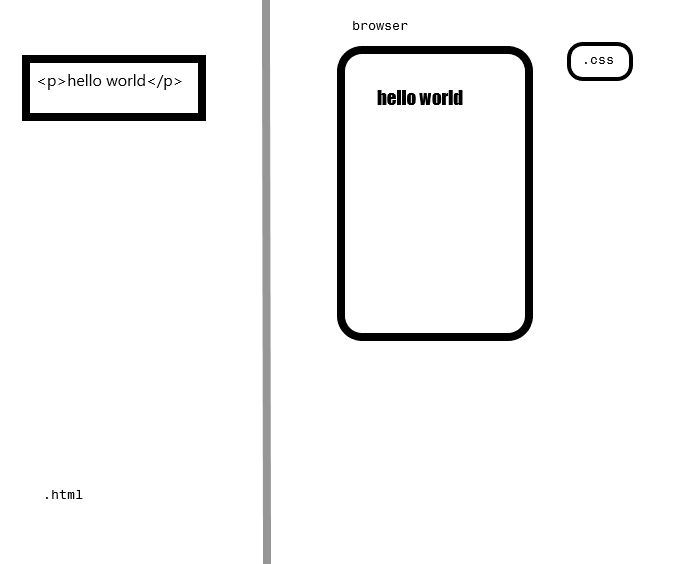
A static web page
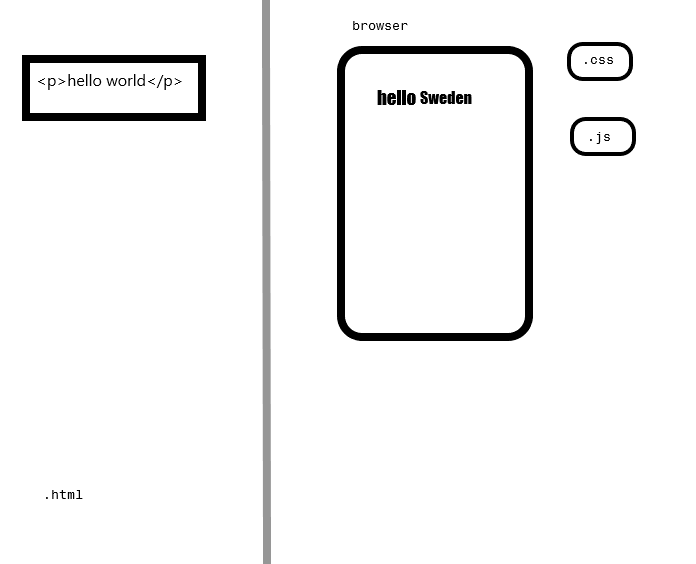
A static web page
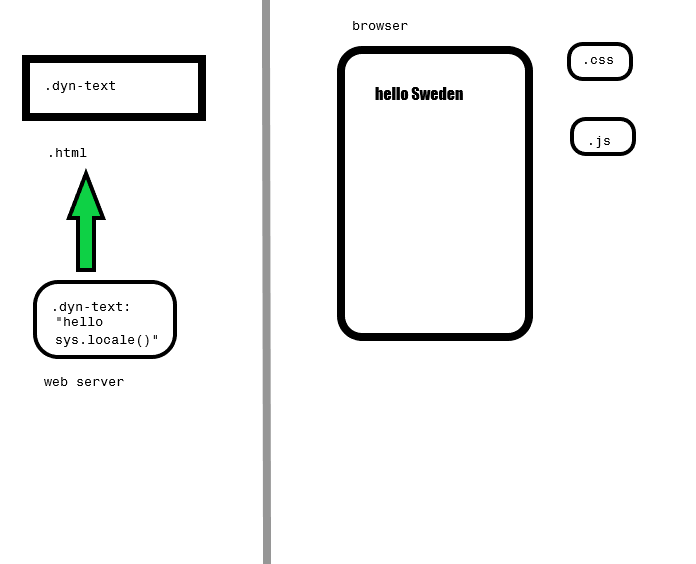
A dynamic web page
“Scalable Vector Graphics”
A standardized markup format for describing shapes:
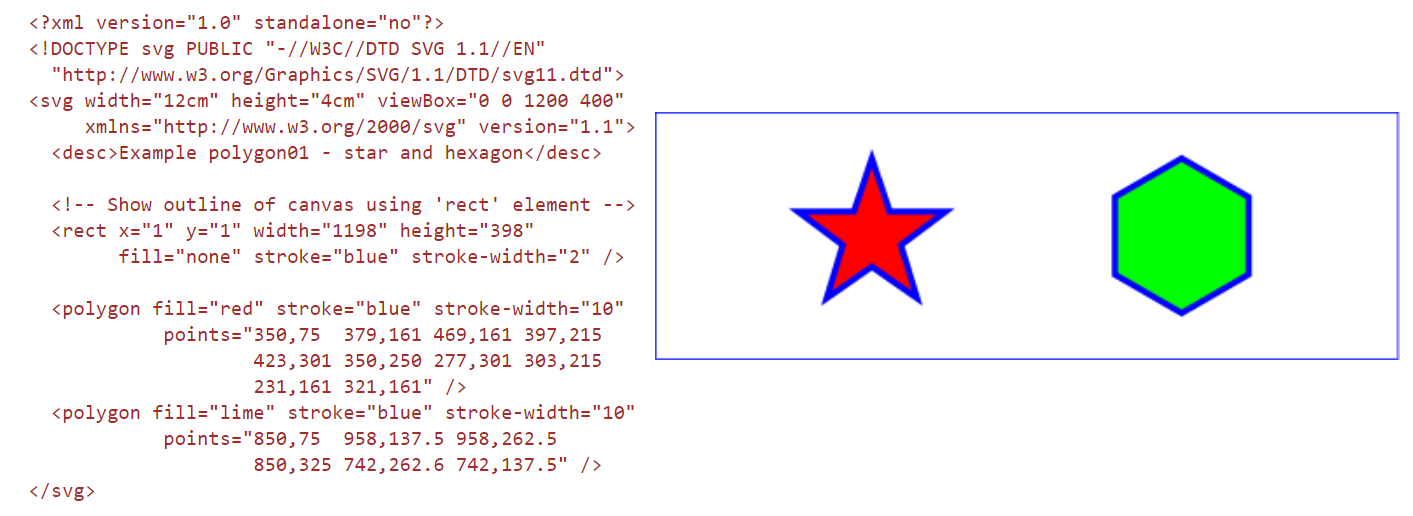
svg
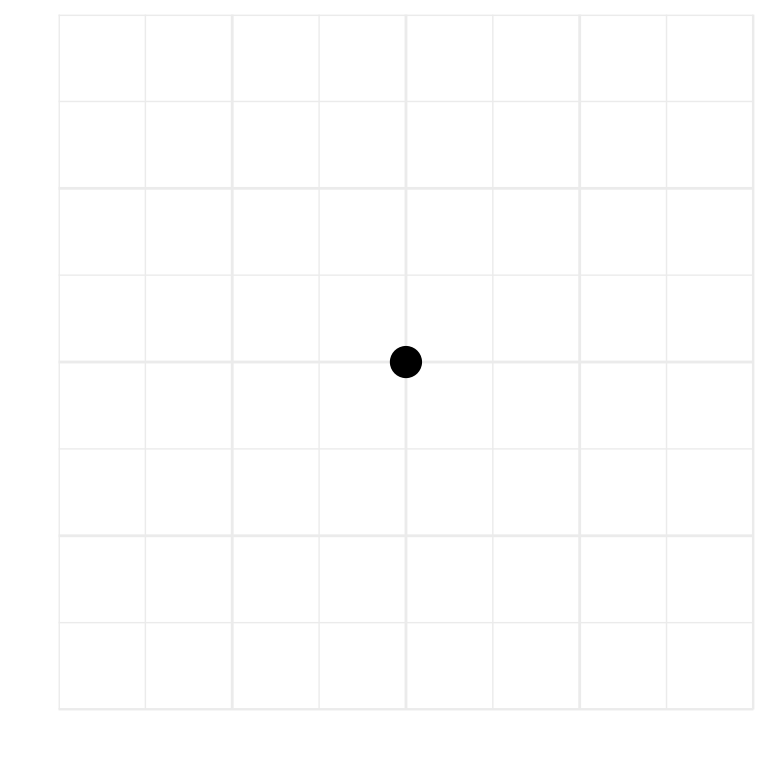
<symbol id="gridSVG.pch19" viewBox="-5 -5 10 10" overflow="visible">
          <circle cx="0" cy="0" r="3.75"/>
</symbol>A number of toolkits have spun off based on d3.js
library(gginteractive)

spans <- seq(.3, 1.5, by = .1)
p4 <- ggplot(mtcars, aes(x = wt, y = mpg)) +
  geom_point(size = 2) +
  lapply(spans, function(x) geom_smooth(method = "loess", span = x, se = FALSE))

controls <- 0:length(spans)
names(controls) <- c("none", spans)
p4 %>% mesh_geom("smooth", attr = "opacity",
control = radio(controls))Interesting applications:
For making your own interactive figures: