The Causal Roadmap
Causal inference series
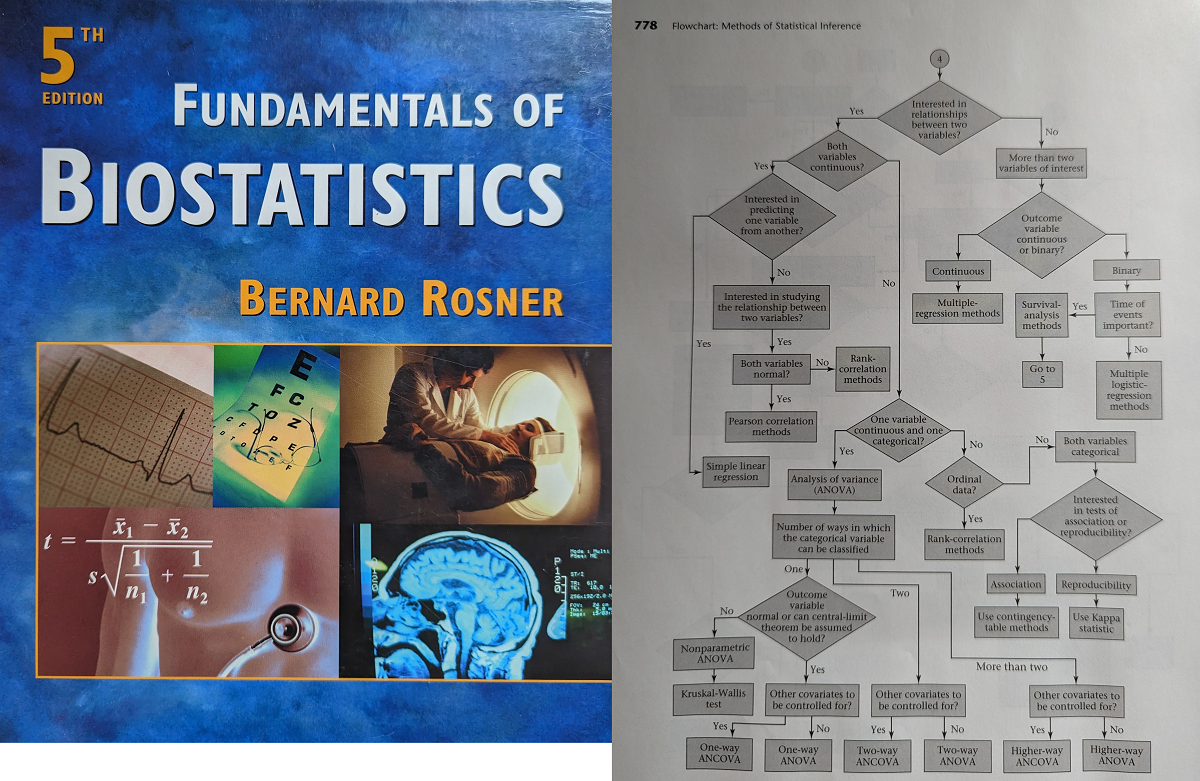
We do a bad job teaching statistics

Sound familiar?
What type of data do you have?
- Continuous \(\rightarrow\) linear regression (but only if it’s normally distributed!)
- Binary \(\rightarrow\) logistic regression
- Time to event \(\rightarrow\) proportional hazards regression
This approach serves you poorly because it does not reflect how we expect you to do research
The causal roadmap/estimand framework
Overview
- Translate the scientific question of interest into a formal causal parameter
- optional: define the ideal study
- Specify a model for the generating mechanism of the observed data, with the causal parameter in mind
- i.e., a DAG and some other assumptions
- State the identifying assumptions, and, derive the statistical parameter
- under what conditions can the observed data narrow down the causal parameter to a single value?
- Specify statistical model, the thing you will use to estimate the statistical parameter and account for sampling variability
Overview (2)
- Estimation and interpretation
- Derive causal bounds for the causal parameter when not identified
- address sensitivity of results to the identifying assumptions
Plans
I’d like to briefly review 1-4, and focus mainly on the “statistical gap”, number 5. Hopefully to help “what model should I use?”
If you are interested, a lot of my own research is about 6.
Causal inference
- Causal effects can be thought of as the change in the summary statistic of an outcome variable associated with the manipulation of an exposure variable from/to a particular level.
- We have observations, which are usually generated via mechanisms that do not involve manipulation of the exposure.
- The goal is to use the distribution of the observations to inform us about the causal effect of interest
DAGs and observations
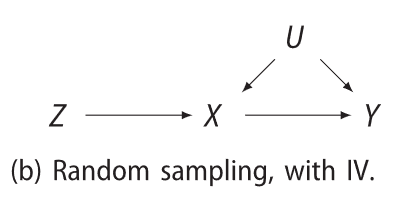
A directed acyclic graph (or DAG or just graph) conveys our assumptions about the mechanisms that gave rise to the observations, e.g.,

This is a functional causal model \(\{F_V:pa(V)\times U_V\to V\mid V\in\mathcal{V}\}\), e.g., \(y = F_Y(x, u, \varepsilon_Y)\).
Note
There are other frameworks for specifying a causal model, this is just one of them (the “Pearl model”, aka, NPSEM-IE).
The main other one that has led to many results in the causal literature is the Neyman/Rubin potential outcomes framework.
Effects
- A causal effect will be written as e.g., \(p\{Y(X = 1) = 1\} - p\{Y(X = 0) = 1\}\), where \(Y(X = 1)\) is the potential outcome which means
the variable \(Y\) if \(X\) were intervened upon to have value 1.
- Think of the DAG where \(X\) has no parents, i.e., \(X\) depends on nothing other than what we set it to
- This is only a example of a causal contrast, a comparison of a feature of the outcome under different interventions
Example
The scientific question
Does drinking coffee in childhood stunt growth?
- Design an ideal study to answer this question. Ignore all restrictions due to ethics, resources, time, etc.
- study population
- intervention
- how you would measure the effect
- draw the DAG for this hypothetical study
Example continued
What causal parameter did you choose?
Note
causal target, causal contrast, causal metric, all mean the same thing
Some options:
- Average causal effect: \(E\{Y(1)\} - E\{Y(0)\}\)
- Conditional average causal effect: \(E\{Y(1) | X = x\} - E\{Y(0) | X = x\}\)
- If \(Y\) is binary, the risk difference: \(P\{Y(1) = 1\} - P\{Y(0) = 1\}\)
- Ratio: \(P\{Y(1) = 1\}/P\{Y(0) = 1\}\)
- Number needed to treat: \(1 / [P\{Y(1) = 1\} - P\{Y(0) = 1\}]\)
- Odds ratio:
\[ \frac{P\{Y(1) = 1\}/P\{Y(1) = 0\}}{P\{Y(0) = 1\}/P\{Y(0) = 0\}} \]
What makes a good causal parameter?
The answer is complicated, see Colnet et al. (2023) Risk ratio, odds ratio, risk difference… Which causal measure is easier to generalize?

Some key tips:
- Choose something meaningful/interpretable to you, consider the statistical distribution of the outcome and what would be useful summary statistics (e.g., mean, median, probability of exceeding a threshold)
- Do not use the odds nor hazard ratio because it they are not logic respecting, i.e., the measure in the full population can be outside the range of measures defined in subpopulations (generally considered to be a paradox)
Example continued
Now consider the real world data. Suppose we use the conscription register in Sweden to answer this question. The observed data include
- Height measured at age 18 - 20 in people joining the military
- Self-reported coffee consumption before age 12
- Everything else available in the registers (e.g., highest education level of parents, hospitalizations and prescribed drugs)
Draw the DAG for the data generating mechanism
Identifiability
Is the effect of interest identifiable from these data?
Rules of thumb:
- If the two variables of interest share an unmeasured common cause, the effect is not generally identified (unmeasured confounding)
- If the selection mechanism has both the exposure and outcome as parents, the effect is not generally identified (selection/collider bias)
Identifiability continued
Fear not, there are algorithms that, given a DAG and an effect, determine whether it is identified and if so, give the statistical estimand (Tian and Pearl 2002 -)
If the effect is identifiable, the estimand is some variation on the g-formula:
\[ E\{Y(a)\} = \sum_x E(Y | A = a, X = x) P(X = x | A = a). \]
Important
This still involves unknown quantities: the mean outcome given covariates and observed treatment, and the distribution of covariates given treatment.
We need to estimate these things using statistical models. Which ones and how?
This is the statistical gap
Closing the statistical gap
- Regression models and adjustment
- Propensity scores (weighting, adjustment, matching, …)
- Doubly robust estimation
- Targeted minimum loss estimation
- Double machine learning
- …
Testing your understanding
True or false?
- Mike believes that you should never use logistic regression.
- DAGs are the only way to convey your causal assumptions.