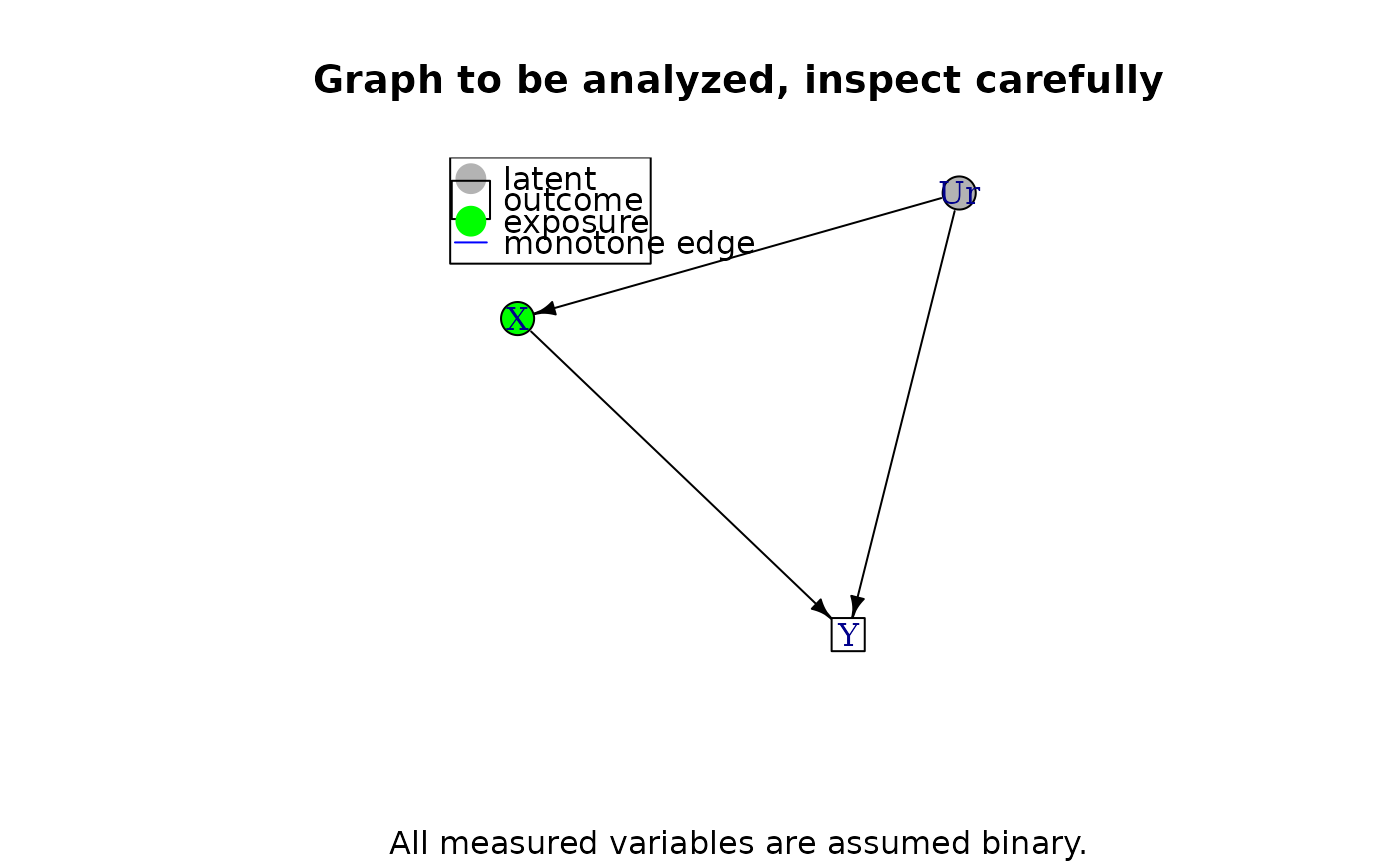
Plot the graph from the causal problem with a legend describing attributes
Source:R/analyze-graph.R
plot.linearcausalproblem.RdPlot the graph from the causal problem with a legend describing attributes
Usage
# S3 method for class 'linearcausalproblem'
plot(x, ...)See also
plot_graphres which plots the graph only
Examples
b <- graph_from_literal(X -+ Y, Ur -+ X, Ur -+ Y)
V(b)$leftside <- c(0,0,0)
V(b)$latent <- c(0,0,1)
V(b)$nvals <- c(2,2,2)
V(b)$exposure <- c(1,0,0)
V(b)$outcome <- c(0,1,0)
E(b)$rlconnect <- c(0,0,0)
E(b)$edge.monotone <- c(0,0,0)
q <- "p{Y(X=1)=1}-p{Y(X=0)=1}"
obj <- analyze_graph(graph = b, constraints = NULL, effectt <- q)
plot(obj)